You raised spend. Registrations went up. GGR didn’t move.
Maybe it nudged — 5%, 8% — while the budget climbed 25%. The affiliate dashboard looks fine. Every surface metric points at a healthy campaign. But the deposit line isn’t growing.
The uncomfortable answer: you’ve been measuring the wrong thing.
The Number Your Dashboards Call a Win Is Costing You Money
Registration volume is a visibility metric, not a revenue metric. A player who registers and never deposits consumes exactly the same acquisition budget as one who becomes a regular — and returns nothing.
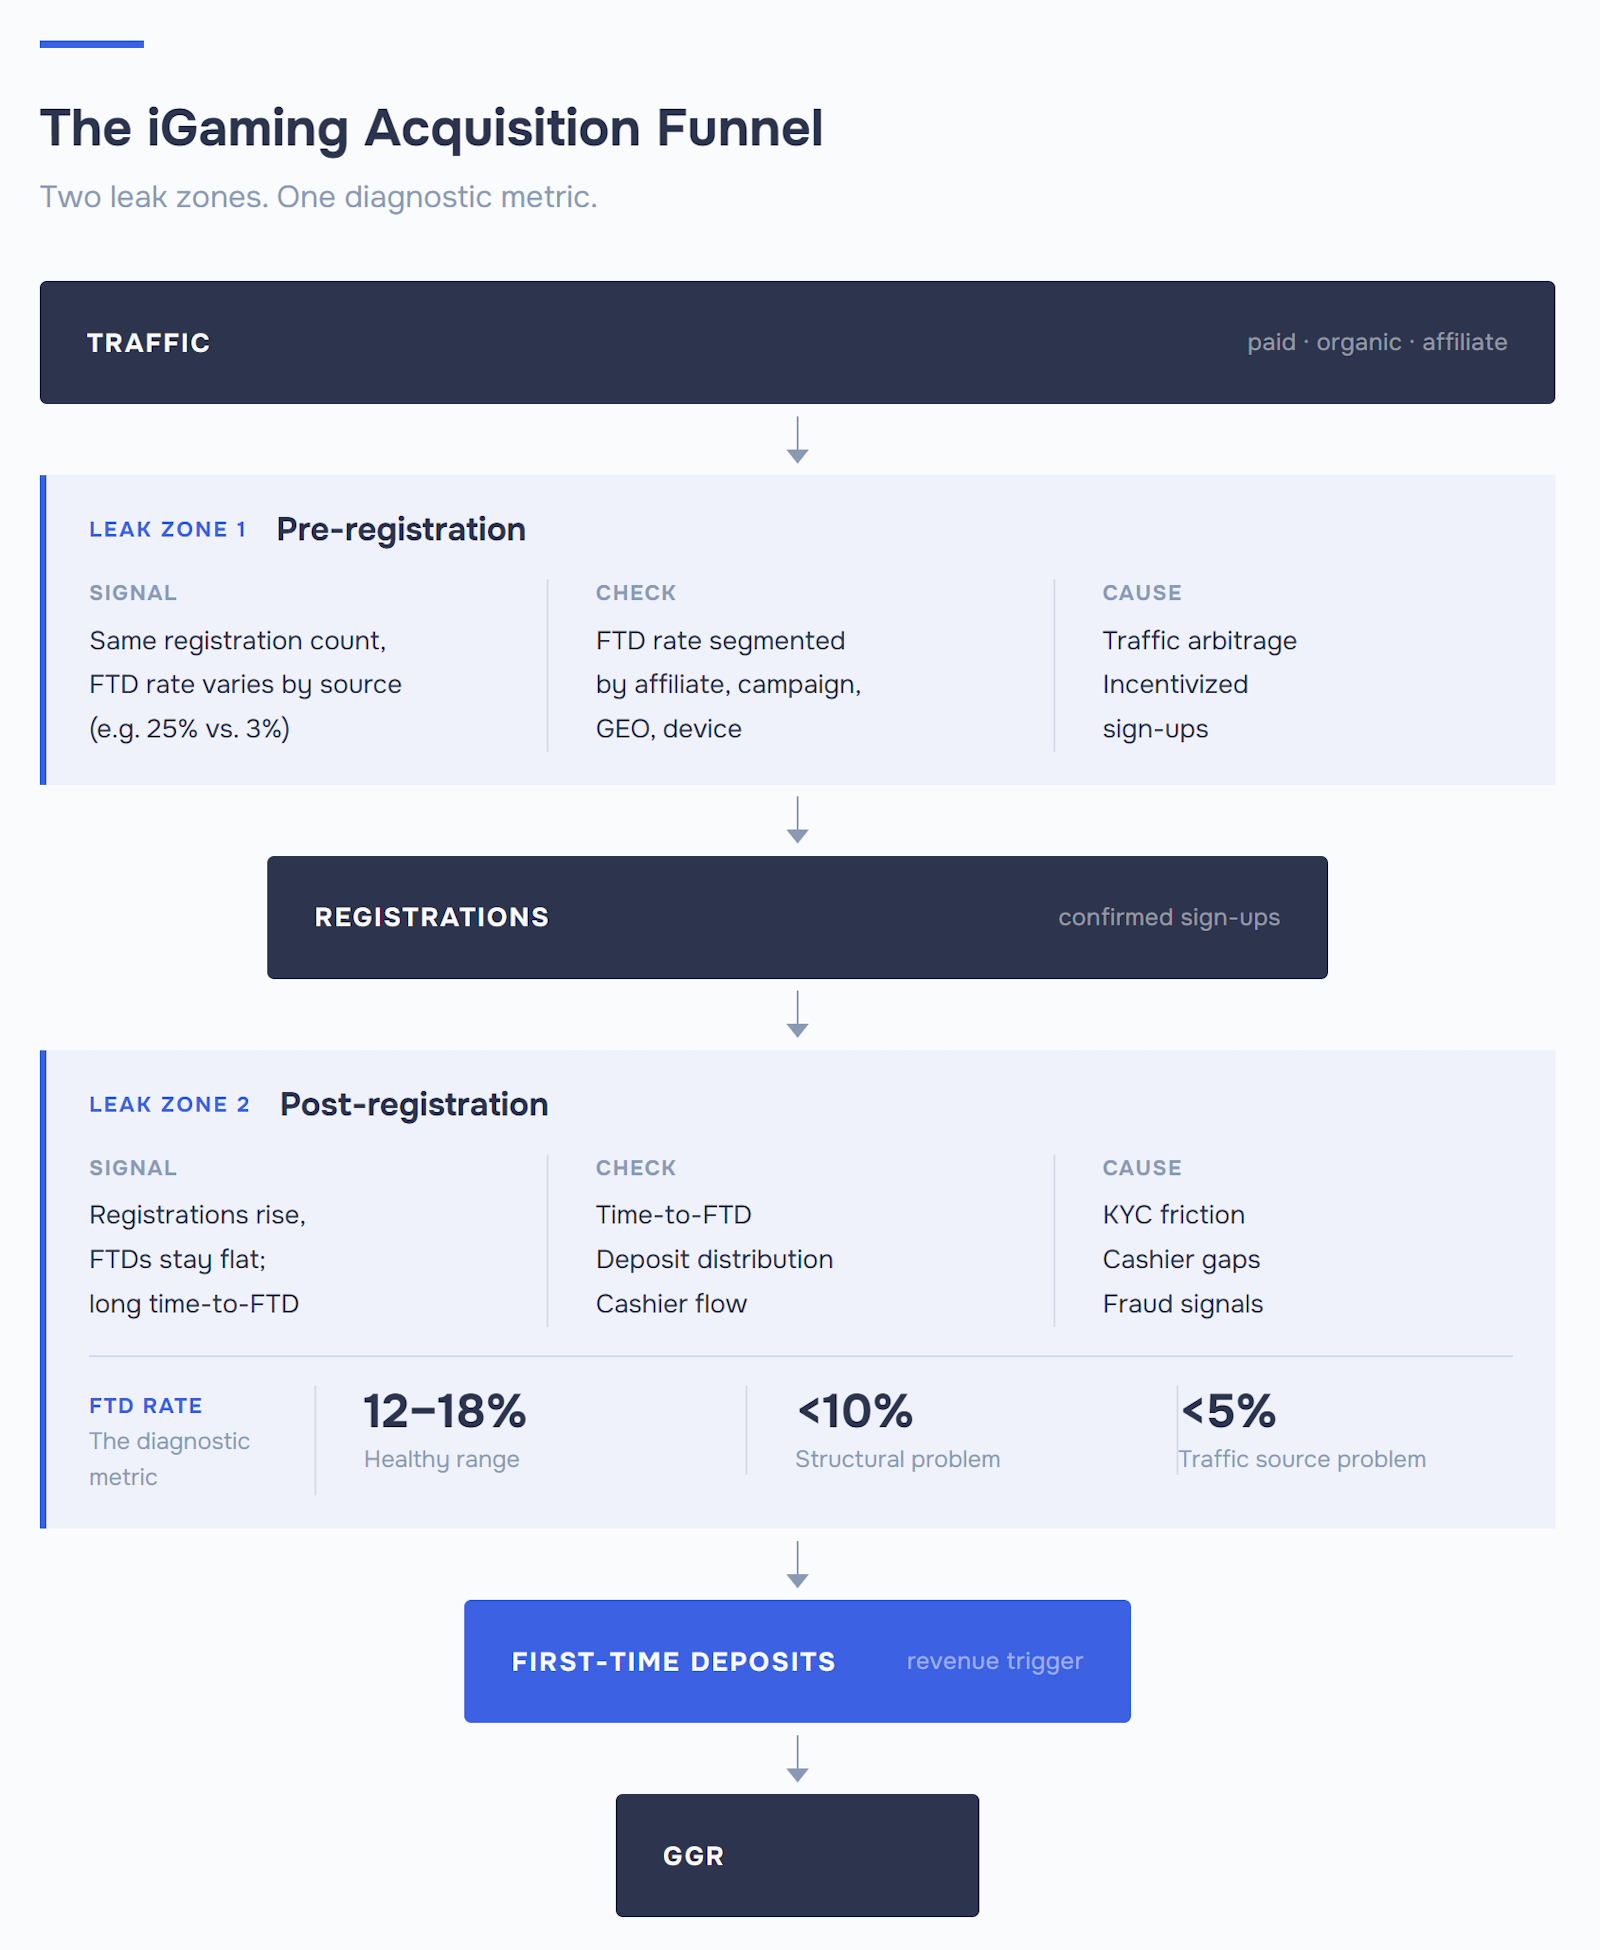
The metric that tells you whether casino player acquisition is working is FTD rate: first-time depositors divided by total registrations. In competitive markets, a healthy FTD rate sits between 12% and 18%. Below 10%, something structural is wrong. Below 5%, your traffic source is the primary problem.
What makes this easy to miss: registrations feel like traction. They’re easy to report, forecast, and defend in a budget review. Most acquisition teams know their FTD rate. They just don’t lead with it. iGaming growth plans rarely fix this reporting habit — because the number is going up, and a number going up doesn’t invite questions.
Two Leak Points, One Identical Symptom
Both problems look identical on a dashboard: registrations up, revenue flat. And a blended FTD rate of 10% can easily be 27% from one channel and 2% from three others — the aggregate hides the source entirely.
The diagnostic starts with one question: which side of the registration is failing? Pre-registration failures are traffic quality problems — the players arriving don’t intend to deposit. Post-registration failures are product problems — players who wanted to deposit couldn’t get through.
The five failure modes map onto those two categories:
| Funnel stage | Signal metric | What failure looks like | Likely cause |
|---|---|---|---|
| Pre-registration: traffic intent | Click-to-registration rate by source | High clicks, low sign-ups | Misaligned audience, weak landing-to-offer match |
| Pre-registration: traffic quality | FTD rate by affiliate/campaign | Same registration count, FTD rate varies wildly (25% vs. 3%) | Traffic arbitrage, incentivized sign-ups |
| Post-registration: onboarding friction | Time-to-FTD | Long lag between registration and first deposit | Complex KYC, missing payment methods, unreadable bonus terms |
| Post-registration: cashier performance | Payment success rate | Players attempt deposit, transactions fail | Unsupported local wallets, slow payment rails |
| Post-registration: fraud signal | Deposit size distribution | FTDs cluster at exact minimum thresholds by GEO | Incentivized schemes gaming CPA payout triggers |
Most operators are dealing with two of these simultaneously, which is exactly why blended metrics hide both.
Pre-Registration vs. Post-Registration: The Evidence Trail Looks Different
When the leak is in traffic quality, FTD rate varies sharply between sources even when registration volumes look similar. Two campaigns generating 1,000 registrations each can produce 280 FTDs from one and 25 from the other. The 25-FTD campaign is destroying unit economics. In our work across UK, German, and Australian-licensed operators, casino player acquisition costs $250–$650 per first-time depositor, with CPMs for top gambling keywords exceeding $350. When a channel produces FTD rates below 5%, you’re paying full acquisition cost for players who were never going to deposit.
The incentivized traffic variant is harder to catch. Deposits appear on schedule, CPA counters tick up, everything looks healthy — until LTV collapses after session one. The tell: deposits cluster at exact minimum thresholds by currency. That’s arbitrage dressed as player data, and it corrupts your cohort data.
When the leak is post-registration, the signal shifts. FTD rate drops after an onboarding change while traffic quality stays constant — a new KYC step, a cashier update, a bonus restructure. A drop in first-time deposits without a matching drop in registrations nearly always means you introduced friction somewhere between sign-up and payment.
The friction points that come up most often:
- Payment method mismatches: a player in Brazil or Southeast Asia who doesn’t see their preferred wallet at the moment of decision will leave.
- KYC flow length: more steps, fewer completions.
- Bonus term opacity: wagering requirements written like a legal disclaimer make players hesitate, not deposit.
All of this assumes you’re tracking the right event. Most paid acquisition setups track clicks and registrations. Actual deposits rarely make it back to the ad platform. When ICODA ran a Meta campaign for a crypto casino across five Asian markets, the team built the tracking around deposit events from day one: Facebook Pixel with server-side CAPI to capture the full conversion path past browser restrictions and cookie drop-off. The campaign produced 136 confirmed deposits, an average cost per deposit of $8.40, and a 4,100% ROI on $2,000 spent. What that made possible: every GEO scored on actual deposit performance, not clicks. You’re running a revenue audit on registration data.
The Four Checks That Localize the Problem
Before restructuring affiliate deals, rebuilding the cashier, or killing a campaign, run four diagnostic checks.
- Segment FTD rate by source. Break registrations and FTDs down by affiliate, campaign, GEO, and device. Don’t work from blended numbers — they hide your worst performers behind your best.
- Measure time-to-FTD. Players depositing within 30 minutes of registration show purchase-ready intent. Players taking 3–5 days are hesitating, and most won’t return.
- Check deposit size distribution. If FTDs cluster at exact minimum thresholds across GEOs, you’re looking at incentivized traffic, not organic player acquisition. The fix isn’t a better landing page — it’s clawback clauses, affiliate KYC requirements, and baselines in your CPA contracts. Without a baseline, a “no minimum” CPA deal is an invitation to game your funnel.
- Walk the cashier yourself. Go through registration to first deposit as a new user in your top three GEOs. Time every step. Note which local payment methods appear first. You’ll find most cashier friction in under ten minutes of manual testing — which is exactly why it persists. Nobody walked the flow.
This sequence tells you where the leak is. It doesn’t fix it. The fix depends on your specific funnel data, affiliate mix, and markets.
What We Find When We Run This on Real Operator Data
The same two or three funnel leaks account for most of the gap between acquisition spend and revenue — and none of them appear in registration reports. Operators building iGaming business growth strategies find this out at the diagnostic stage, not after another budget cycle.
Usually it’s one affiliate source routing low-intent traffic and distorting the overall rate. A GEO where the cashier is missing the payment method 60% of local players use. And one step in the KYC flow — usually the second screen — where 15–20% of players with genuine intent drop off.
The problems aren’t exotic. They’re structural — and the standard acquisition dashboard was designed to count, not diagnose.
The audit takes about a week. The output is a short list: worst-performing source, highest drop-off stage, and the one change most likely to move FTD rate in the next 30 days.
Applying it to your actual numbers — your affiliate mix, your GEOs, your cashier — is a different conversation. If you want to run it on real operator data, that’s what ICODA does. The structure stays the same. The numbers don’t.
Frequently Asked Questions
It’s one of two things — low-intent traffic arriving, or onboarding friction stopping real intent from converting — and they look identical on a blended dashboard. The fastest way to split them is to segment FTD rate by source: if one affiliate sends 1,000 signups and another also sends 1,000 but delivers five times the FTDs, the first source is a traffic quality problem, full stop. If FTD rate dropped across all sources after you pushed a platform update, you introduced friction somewhere between sign-up and payment. Most operators are dealing with both at once, which is why a blended rate around 10% can mask a source producing 27% sitting next to three sources producing 2%.
In competitive regulated markets, 12–18% is functional. Below 10%, something structural is wrong. Below 5%, your primary traffic source is the core problem, not your onboarding. The tricky part is that 10% overall can be built from wildly different source-level rates — a healthy 25% affiliate hiding three sources at 2–3%. You don’t have a “10% problem,” you have a sourcing problem that an aggregate metric is obscuring. Healthy acquisition benchmarks only matter when you’re reading them at the source level, not blended.
The tell is deposit size distribution clustering at exact minimum thresholds across currencies — if 80% of your FTDs in a GEO land precisely at the qualifying floor, those aren’t organic players, they’re someone triggering your payout. Real players deposit at varied amounts. The structural fix isn’t better fraud tooling alone — it’s clawback clauses in the affiliate contract, a minimum deposit baseline built into the CPA definition, and a second-session activity requirement before the commission fires. A “no minimum” CPA deal is an open invitation to game your funnel; the affiliate carries no downside risk, so some will optimize for the payout trigger rather than player quality.
Tracking clicks and registrations tells you where traffic came from, not whether it produced revenue. When your optimization signal is registrations, the ad algorithm learns to find people likely to register — which is a very different audience than people likely to deposit. Deposit event tracking, ideally via server-side CAPI to survive browser restrictions and cookie drop-off, lets the algorithm find real depositors. The cost-per-deposit becomes the optimization signal, not cost-per-click. Without that, you’re running a revenue audit on registration data and wondering why scaling spend doesn’t scale GGR.
Because you’re paying acquisition cost per registration, but your revenue comes from depositors — and a channel with strong signups and weak FTD rate is destroying your unit economics. Two affiliates sending 1,000 registrations each at the same CPA look identical in cost. If one produces 280 FTDs and the other produces 25, the second affiliate is costing you full acquisition price for players who were never going to deposit. The registration metric is a visibility signal. It confirms that someone saw your offer and clicked through. It tells you nothing about whether that person had any real intent to fund an account.
Yes, and it’s the easier fix. Traffic quality problems require renegotiating affiliate deals, auditing sources, or rebuilding targeting — that takes weeks. Cashier friction can often be found and fixed in a single afternoon. Most operators have never gone through their own registration-to-deposit flow as a new user in their top three GEOs. When you do, you find: a preferred local payment method buried on page two, a bonus terms screen written in legal language that makes players hesitate, or a KYC prompt that fires before the player feels invested enough to complete it. A drop in FTD rate immediately after a cashier update — without any change in traffic source — is a clear product signal. Walk the flow before you start questioning your affiliates.
Share with


Rate the article